You are an early adopter of genetic diversity testing through UC Davis and BetterBred. On the day your results release, you excitedly open your email to find a pretty certificate, and also an email from BetterBred that your results have uploaded. You visit your dog’s profile on BetterBred only to see a WHOLE LOT OF NUMBERS most of which (all of which?) mean little or nothing to you at all. How do you use these numbers? What does it say about your dog? Do not worry, you aren’t alone in your confusion and we will walk you through it!
First we should say a few things. The breed management software at BetterBred was carefully designed to maximize retention of the biodiversity of a breed as well as to reduce inbreeding in litters. Due to this, over time, breeds can enjoy better long term health outcomes and remain viable for the long term. Individual litters are more likely to be larger, healthier, and have better long term health outcomes as a whole. While this sounds important, understanding biodiversity and how to breed for it can be difficult. Add to that the question of whether your dog’s results mean something BAD, learning about this new tool can be overwhelming. But, take note: a dog’s genetic diversity profile does not mean a dog is good or bad. This is descriptive information solely meant to guide you in managing your line and family while you also contribute positively to your breed’s future. If you are uncertain what biodiversity means, please read the box below with Natalie Green Tessier’s explanation, Founder and CEO of BetterBred.
First of all – what is biodiversity?
Most breeders think of DNA as coming in two options- a good gene, or a mutant gene – like it is in many DNA tests. In fact, there are many genes or (in this case) markers that come in a great many variations – like a t-shirt that is available in different colors. The more variants there are, the more information we have about population genetics. In more inbred breeds, there are fewer variants for each marker. So an inbred breed might have only a few colors available in t-shirts, whereas a diverse breed will have many colors of t-shirts. Apart from the relatively small number of genes that make up specific, visible breed traits, the rest of the gene pool is generally healthier when there’s lots of variation.
Unfortunately when breeders select too strictly for too long for very specific traits, there can be an unintended loss of variation in the parts of the DNA that thrive with more variation. A good way to assess whether that good variation has been impacted is using the markers found in the VGL canine diversity test. Because they are considered neutral – or not associated with any specific known trait – they are great for assessing genetic diversity. In breeds with ample diversity, there will be lots of variations for each marker (lots of colors in the t-shirt drawer.)
But what if you have a breed without much variation? Well, this happens, and can happen quite often. In this case the best thing breeders can do is try to make sure the variants that are in the breed are well distributed – so there are plenty of all of them in the breed. Imagine a t-shirt drawer with lots and lots of red t-shirts and only one blue one and one green one. If you lose one of the red ones, it doesn’t change much about the t-shirt drawer – there are lots of other red ones. But if you lose either the blue or green one, the variation is seriously diminished. If, on the other hand a third of the shirts are red, and a third are green and a third are blue, then it’s a lot harder to lose the existing variation in the drawer, even if you lose one once in a while and even though there are only 3 colors.
So now you understand more about biodiversity. But how do you use your dog’s individual results to help contribute to your breed’s future? We as breeders are accustomed to genetic results giving us black or white answers about our dogs. If a dog is a carrier for a recessive disease, this means you don’t breed that dog to another dog that carries this mutation as well. This is relatively easy. In the case of genetic diversity results, however, we are dealing with several measurements and shades of grey. Try to consider genetic diversity testing the same way you breed for the complete dog; while you might breed for the perfect dog, no dog is perfect, and you select a mate that completes the overall picture of what you want for a breeding. So, too, you must look at genetic diversity.
Let’s discuss the main individual measurements you receive on BetterBred and what they mean.
The first thing you see under a dog’s genetic profile: Dog Leukocyte Antigen haplotypes
The dog’s immune system, or DLA, has three different regions; UC Davis VGL tests two of these three regions and definitively identifies the haplotype, or pattern of DNA each dog has, something that is difficult for many testing companies to do. While many people want to know “Is my dog’s DLA haplotype good or bad?” this region usually is descriptive and rarely are DLA haplotypes causative for a disease. Therefore, it is very rare that a DLA haplotype is “bad”.
Due to some studies that have shown a positive impact of having heterozygous DLA on both fertility and for protection against autoimmune disease, we recommend attempting to breed for heterozygous DLA. We also recommend keeping healthy, high quality dogs with DLA haplotypes that are not well represented in a population in our breeding programs. We do, however, discourage hyperfocusing on the DLA, because it is only a small part of the dog genome; but it’s important to understand that if any specific DLA haplotype is inadvertently bred out of a population, it can only be restored by outcrossing to another breed. We therefore recommend keeping an eye on the percentages of those haplotypes found in the breed when we make our breeding decisions.
DLA haplotypes almost never change generation to generation, and class I and class II haplotypes are tightly linked, so they are almost always inherited together as a pair. The class I DLA haplotypes and the Class II haplotypes as noted on your dog’s profile make a very large haplotype, which is about 2 million base pairs long! Puppies will always inherit one extended Class I and one extended Class II haplotype from each parent.
Remember, this is just one part of the dog’s genome, and if we focus solely on this, we will lose sight of the biodiversity found in the rest of the genome of each dog, and therefore in the breed. To learn more about DLA, read here.
The next important measurement: Outlier Index
With the release of the Standard Poodle data, it became rapidly obvious that there needed to be more information about an individual dog than just knowing whether or not it was inbred. After all, there was a dog known to have a very high influence of a popular sire and kennel who had nearly the exact same inbreeding estimate as a dog found from very obscure and unpopular lines – so we needed a way to discern the difference between them, and the inbreeding measure wasn’t enough.
An important note: none of these measurements will tell you that a dog is good or bad, whether they are or will be healthy or unhealthy, or that they are high or low quality. Breeding using our predictions will help prevent or mitigate genetic bottlenecks, reduce likelihood of breed specific diseases and preserve a breed’s genetic biodiversity. It will always be the responsibility of breeders to select for health, temperament and structure while considering biodiversity as well. These nuanced approaches go hand and hand. To learn more about type and diversity read here.
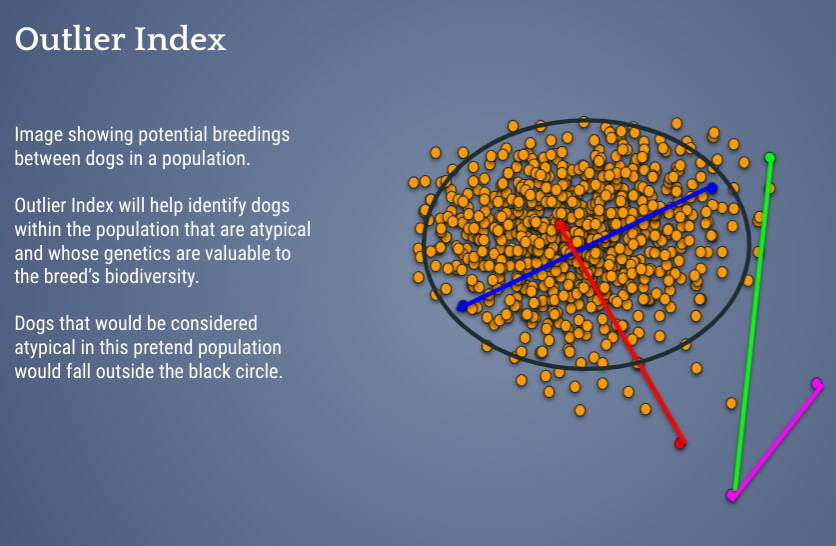
So, the Outlier Index, or OI, is a measure developed in consultation with conservation geneticists and based on thorough review of current scientific research as well as extended pedigrees, and by testing different metrics. The Outlier Index is a calculation that tells you how important a dog’s overall genetics are to preserve in the population. Those with a low Outlier Index carry genes that are very well represented in a population and not at risk of being lost – therefore one may judge them with very strict criteria for structure and temperament when selecting which ones to breed. A dog with a higher than breed average Outlier Index is more likely to have under-represented overall genetics in the breed and should be more carefully considered for the preservation of biodiversity of the breed. As always, we only recommend breeding healthy dogs, no matter their “numbers”.
Often we are asked – what if certain genetics are rare for a reason (read on for more information on this topic)? In other words, what if the less common dogs are just less healthy? Remember, this panel was carefully selected and validated by a team of DVM, PhD and biostatisticians at UC Davis specifically because the markers are “neutral”. That means they do not code for anything in the genome, therefore they are assumed not to be associated with any negative or positive trait in your dog, and they are therefore highly informative for revealing the existing biodiversity of a breed.
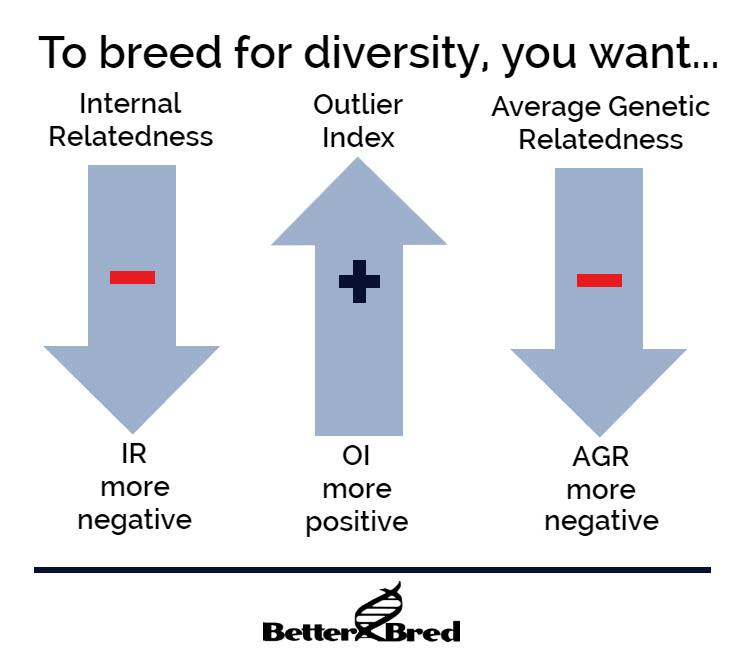
It’s also important to note that because the markers used in the VGL diversity test are not linked to genes that create appearance, a high OI in an individual dog will not mean they lack “breed type”. To breeders who have breeds with a low average OI, a dog with a .4 OI may seem exceptionally high! But since each breed has its own population structure based on its own history, please consider that there are breeds with well managed biodiversity where .4 is normal, and these breeds also are very typey despite the higher OI! It is perfectly reasonable to breed for higher than breed average – as well as individual OIs – and still expect to produce typey dogs. We must breed away from any genetic bottlenecks in our breeds to preserve them for future generations. However, selection for health etc will always be the responsibility of the breeder within a breed. You are breed conservators of the future generations. To breed to maintain your breed’s biodiversity, breed for a higher than breed average OI – this is the only metric on BetterBred that you want to go up each generation.
A step further: Average Genetic Relatedness
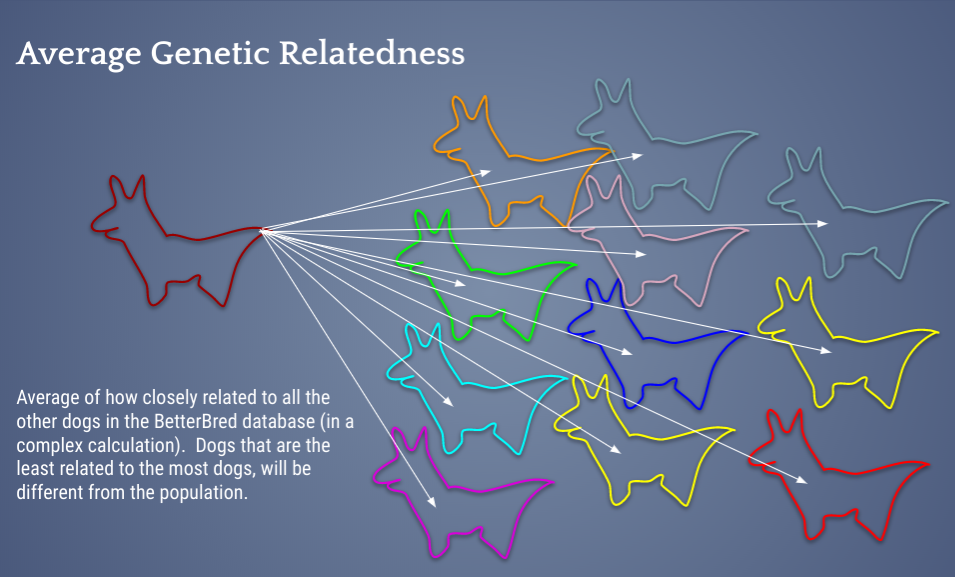
To further aid in maintaining the biodiversity BetterBred also uses Average Genetic Relatedness, or AGR. This measures value to the breed as does the OI, but does so using a very different method to calculate genetic relatedness from one of the most advanced peer reviewed methods to date. This measurement was implemented after careful review of the literature over the last 15-20 years on conservation genetics and maintenance of genetic diversity in closed gene pools.
This concept, which uses the genetic markers and their frequencies from your breed report, is very similar to the term “mean kinship”. Mean kinship uses pedigrees to calculate relatedness through shared ancestry and relatedness to other dogs in a breed. While mean kinship is powerful and interesting, all full siblings will have the same mean kinship, but we know and have seen that two puppies from the same litter can vary drastically from one another (read on to see how and why). AGR will identify individual dogs that are less related genetically to the other dogs in the BetterBred database.
Why is a low AGR good? This will give you more healthy mate options in the database for your dogs. Most people like to have options when breeding!
AGR is another measurement that is meant to identify dogs whose genetics may be under-represented in a population. It is inversely related (with statistic significance) to OI. This helps support both measurements’ validity as well as show how they might complement each other when breeding for the preservation of a breed and its biodiversity. To breed to preserve biodiversity, select for a lower than breed average AGR.
Next we find the dog’s inbreeding estimate, Internal Relatedness or IR.
UC Davis estimates the inbreeding value of a dog using a measurement called Internal Relatedness or IR. This estimates how inbred a dog is using the frequencies of the breed in a somewhat complex calculation. The higher this number (more positive), the more inbred. The lower this number (more negative) the more outbred. According to Dr. Niels Pedersen, DVM PhD, an inbreeding value of .15 or above would be considered high within a breed.
People tend to think that they should breed for the lowest IR possible. Why might this not be a good idea? To understand, we need to understand the structure of a breed. We discuss often the terms “Average Effective Alleles”, or Ne, and the term “Average Alleles per Locus”, or Na. In many breeds, the latter number, Na, is high! What does that mean? It means that there is a lot of biodiversity (t-shirt colors in the boxed example above) in the breed as a whole. Hooray. That’s a great place to be! But then when we look at the former number, Ne, we see a different story. In some breeds the Ne, or alleles that are contributing most to a population, can be as low as only 2. This would be like having only two t-shirt colors that constitute the majority of your wardrobe in the above example on biodiversity.
Now imagine you have a dog with mostly one type of markers and these markers are very well represented, while another potential breeding mate has the other type of markers that are also very well represented in this population. Breeding these two dogs together will produce outbred puppies, however they also will produce puppies that carry very typical for that population genetics. So while you produced outbred puppies, you will still have very typical/well represented genetics and have not done anything to maintain the biodiversity of your breed.
On the other hand, what if you have two dogs that are perhaps a little more closely related, but very atypical? Might it be a good idea to breed them together to have a higher IR, but also maintain those atypical bloodlines? Yes, this is a nuanced approach to breeding for the preservation of biodiversity and should be carefully considered.
For the above reasons, we encourage breeders to consider IR, but consider the other metrics on BetterBred while taking IR in to consideration (as well as all the tools we have considered before). To read more about the above concept, read here.
Let’s now look at a single dog and what the metrics mean for this dog in the scope of its population
This particular dog is from a newly released breed, the Berger Picard (pronounced Bear-jhay pee car – my sincere apologies again to the breed for my coarse pronunciation in their test breeding video).
So, we discussed generally above what all the metrics on a profile mean, let’s look at them here for this particular dog, specifically while taking in to consideration the breed. Note that on each profile there is a reference to the numbers for the breed, so if you know what each means, you can compare your dog’s numbers to the population.
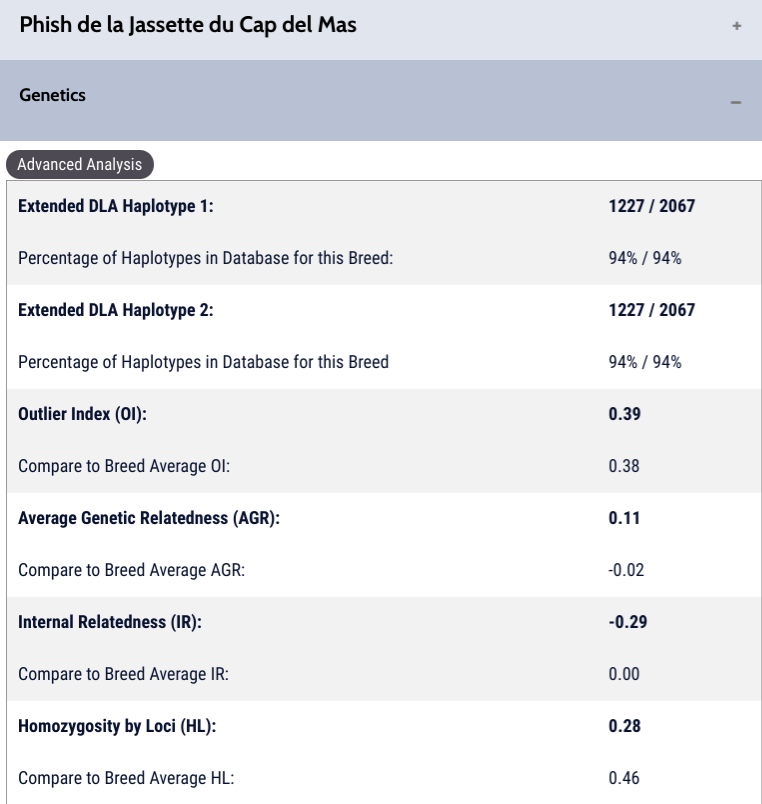
DLA haplotypes: In the Berger Picard breed, nearly all of the tested DLA haplotypes are the same, as there are only two variants found in both the Class I and Class II DLA regions. 94% of the tested markers are 1227 / 2067. 1227 is the Class I DLA haplotype; 2067 is the Class II haplotype. These are inherited together and they do not change from generation to generation (except for random very rare mutations). In this breed we do recommend trying to increase the less common DLA haplotypes found in the breed, as once they are lost to genetic drift, they are gone forever.
Outlier Index or OI: This dog’s OI is .39 which is just slightly above the breed’s average. While this breed has very low biodiversity (Na of 3.64 and a Ne of 2.03), the initial sample has shown breeders are doing a relatively good job maintaining the biodiversity of the breed by keeping a higher breed average OI – if this drops – the breed will be at risk of losing biodiversity to genetic drift. For this reason we recommend breeding at or above breed average OI. By doing this, breeders will maintain their Ne or raise it.
Average genetic relatedness or AGR: Surprisingly, while this dog’s OI is a little above breed average, his AGR is much higher than is typical for the breed. This can be explained because the breed’s biodiversity is so low. As a result, dogs that are outbred (see below) can carry both atypical and typical genetics at their markers. It’s possible this boy was the product of a very atypical parent bred to a very typical parent, resulting in a very outbred puppy who is related to much of the population yet carries atypical genetics (read here to understand this concept – is diversity testing enough).
Internal Relatedness or IR: This dog is very outbred, which means that his sire and dam were unrelated from one another and much of his tested markers are different from one another. While this is good for him, in small genepools this can make it harder to find unrelated breeding mates, due to the likelihood this dog likely carries at least some alleles that are very typical for this population. I had a similar situation with my own bitch, which you can read about here.
So, if this were my dog, what might I consider when breeding him? First, I would look for an unrelated (relatively speaking – remember unrelated within a closed genepool is likely still related) breeding mate that has a higher than breed average OI and lower than breed average AGR. This would allow the offspring of this boy to have more breeding options within the database, while still protecting the biodiversity of the breed. I would also, as a cherry on top while all else is equal, look for a bitch that may carry the other type of DLA haplotype that has been found within this breed, to preserve it from loss due to genetic drift. Of course, I would run the simulated test breeding to view the test breeding summary and advanced analysis to know what genetic values I could expect in my predicted puppies. Remember, you can have puppies all along the predicted ranges for a litter. Also note, the Berger Picard is still in the research phase and therefore some of this may change as more of the population is tested and sampled.
Feeling overwhelmed? You are not alone. This is new information!
It can take a while to learn how to use these metrics for breed preservation. Reading our blogs, playing with our breed management test breedings and talking with others will help you understand using your results. You are not alone in not getting it right away. Please feel free to ask questions and please consider taking our mini course, designed to help you understand how to use our breed management software. Thanks for taking the time to learn!
Remember, breeding for the preservation of biodiversity is a nuanced approach which necessitates considering multiple aspects of a dog’s genetic results while also considering everything as we have in the past – type, temperament, drive etc – as the core of a dog breed is its history and predictability. We would never suggest breeding solely based on the genetic results of your dog. Thank you to those conscientious early adopters moving to preserve your breeds for the future.