Are you confused after reading your breed report and finding discussions about something called average number of alleles per locus (Na) and average number of effective alleles per locus (Ne)? Especially because we do not often talk about these at BetterBred when we are talking about breed management, both in regards to your dogs and to your breed as a whole?
Actually, all of our tools are designed to adjust the value of Ne in future generations, despite the fact that it’s not often mentioned. Our goal, through using all of our tools, is to increase the average effective alleles per locus (Ne), but not any one specific allele or locus.
Let’s talk about what Na and Ne actually mean.
First, what are the technical definitions?
Average number of effective alleles per locus: the number of equally frequent alleles that would take to achieve the same expected heterozygosity as in your population.
Average number of alleles per locus:
“Definition. Individual organisms within a population typically have multiple alleles at a given locus. The variation in the number of alleles across multiple loci within a population can be expressed as the average number of alleles per locus.”
These definitions can confuse a lot of people. So let’s talk about this in a way you might be able to envision it as simply as possible.
Imagine that you have a brand new set of silverware for your kitchen. Let’s say that brand new set has 8 dinner spoons, 8 dinner forks, 8 dinner knives, 8 dessert forks, 8 teaspoons and 8 steak knives. Obviously, you have a nice and even distribution of the type of silverware in your drawer. If you averaged each type, you would have an average of 8 different types of silverware. And since you have the exact same number of each type, the effective number of silverware overall is 8, as no type is over-represented. If they were all jumbled up in the drawer, and you reached at random in to the drawer, you’d have the exact same chance to get any of those types from the drawer. And, say you lose one dinner fork? You still will have seven others to use and it’s unlikely to impact your situation at dinner time.
Now, let’s say you are just starting out in life and need some silverware. You find an estate sale and snag up a cheap set that looks nice but isn’t complete. This time you find 8 dinner spoons, 8 dinner forks, 1 dinner knife, 2 dessert forks, 16 teaspoons and 1 steak knife. You think to yourself, “Self, this isn’t perfect but I mostly need forks and spoons anyway, so I’m going to buy it.” So you do and take them home. Here again, we have 8 different variations. But, if I were to grab from that drawer at random, I’m more likely to get a teaspoon than anything else, as they are far more represented in the drawer. Say you lose your steak knife; now you are down to just 7 different variations (unless you buy a new one, which we can’t really do in our purebred dog breeds without outcrossing).
So too can we view the genetic markers in a population of dogs. When there is a genetic bottleneck in a breed, we often see 1 or two markers at most loci that are over-represented in the population, like the teaspoons from the estate sale silverware above. Likewise, there will be others that are far less well represented. When this happens, we are more likely to lose those less well represented variations to “genetic drift”. Genetic drift is the loss of genetic variation when an individual is not bred or the variation happens not to be passed down. In the estate sale silverware example, if the steak knife accidentally ends up in the garbage, the steak knife variation is extinct from your drawer. If a teaspoon falls in unnoticed, there are still many more available.
How about looking at some example populations with the above concept in mind?
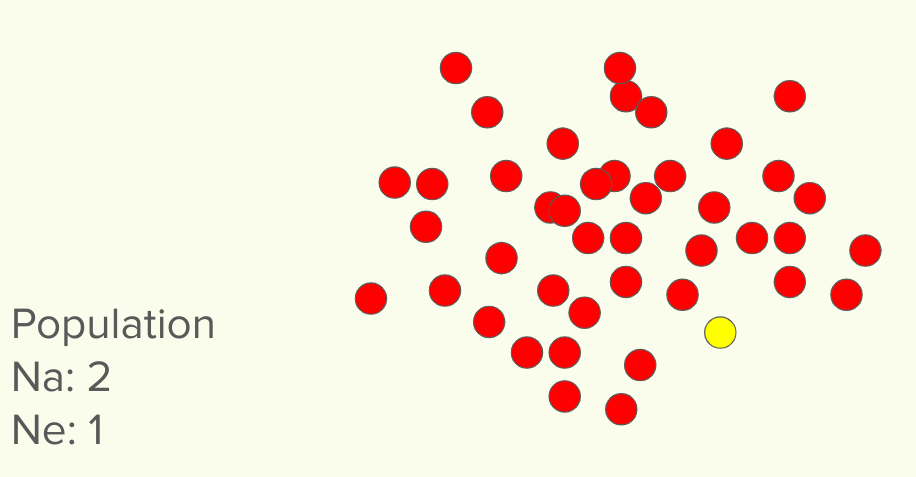
In this first population, we see there are indeed two different markers found. Obviously, the red marker is far overrepresented and the yellow very underrepresented. if you were to randomly pick two, you would almost always get two red markers. In this case, that single yellow marker could easily be lost, while it would be next to impossible to lose the red marker. In this case, the Na for the population is 2. But the EFFECTIVE alleles per locus (here we are pretending there is only one locus) is 1. You can imagine that it’s very easy to lose that one single poorly represented marker, when there is a sea of the other type. Once it is lost, it’s lost forever (without outcross).
Now, for argument’s sake, let us look at a more ideal population.
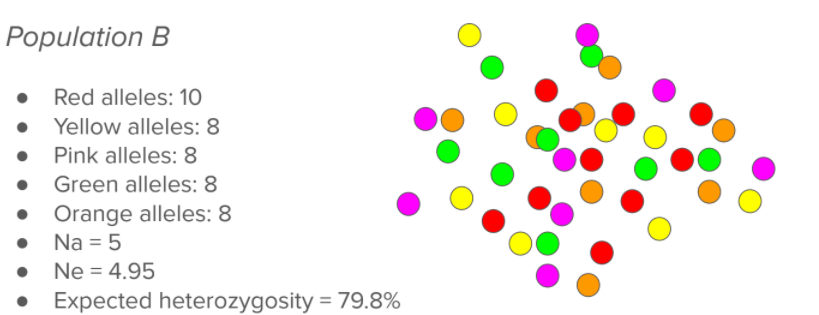
Just looking visually at this population, you can obviously tell there is more variation, and that variation is better distributed. This would be more ideal and what we would strive for in a population, as you could not easily lose any of those colors. You can see overall there are 5 different types of markers (Na = 5) and that since they are relatively well represented, the Ne is very close to the Na (Ne = 4.95). If we were to chose two of them randomly, there would be a 79.8% chance that they would be two different colors. We recommend that breeds strive for this sort of population, rather than the one seen above.
Now, we are often asked, what if we distribute those markers, and those markers were meant to be rare because they are linked to disease?
This is the beauty and original plan of Dr. Pedersen PhD/DVM when he designed this panel. He intentionally used markers that are known to be putatively neutral. This means that these markers do not code for anything in your dog at all. These markers are repeating segments of DNA, like “hiccups”. They mutate frequently, so change more rapidly than other types of markers used (this is valuable when we really are interested in what has happened in our breeds in the last 100 years, rather than thousands for other testing methods). The testing method used in UC Davis’ VGL diversity panel are also widely used in conservation genetics to track diversity in species.
The fact this panel has neutral markers can be both very useful and not so useful! It’s not so useful because we can’t tell you if your dog has a long coat gene, or if it’s a carrier for a new recessive “exploding head disease” etc. But, it’s perfect for tracking the biodiversity of a breed! Other panels ARE designed to give you genetic information about your dog’s coat color, coat type, size or disease genes, but then also they are not good for tracking and maintaining biodiversity. Some genes SHOULD be homozygous in purebred dogs, eg a poodle should always have two curly coat genes!
First, because these regions are neutral, we do not have to be worried that they are uncommon because they are somehow “bad”. Sometimes they are rare because they are close to a gene that is bad or common because they are close to a gene that is desirable. However we don’t ever have to worry because our system never favors one rare marker over another one or one common marker over another one.
Second, as long as breeders are actively selecting for robust health and good temperament, any markers that are rare because they are near a dangerous gene will stay rare. Selection for health is a powerful force. When breeders do that, then the markers that are rare solely because the lines they happen to be in have fallen out of favor for or just are not well known can increase in frequency, and this helps preserve more of the original healthy variation in each breed.
In our observation, the generally healthy breeds may have lots of variation or less variation; but that variation is usually well distributed, where there are fewer rare and common markers and more with average frequency. Redistributing their existing genetic variation therefore can only be good for the health and future of a breed!
Ready to test your dog and contribute to the future of your breed? Order your test here.