The Bernese Mountain Dog community has been off to a great start in assessing the biodiversity of their breed by submitting 41 Bernese Mountain Dogs to UC Davis for analysis. Dr. Niels Pedersen and Dr Felipe Avila were sent their data last month and they have created a preliminary report. While this is likely a good first analysis of the breed, more Bernese Mountain Dogs from all over the world should be tested before the final report is created. Click here to add your Bernese Mountain Dog to the study.
How inbred is the typical Bernese Mountain Dog?
One aspect of the UC Davis canine diversity test is a calculation that estimates how inbred a dog is. This estimate, called Internal Relatedness or IR, is a positive number between 0 and 1 when a dog is inbred, and a negative number between 0 and -1 when the dog is outbred. An outbred puppy would inherit genetics from its sire that were very different from those it inherited from its dam. An inbred puppy would inherit many of exact same genetics from both dam and sire. Being outbred reduces the likelihood of known and unidentified recessive component diseases expressing in individuals. When dogs in a breed are, on average, more outbred, the natural healthy genetic variation in the breed is more easily preserved. When dogs in a breed are, on average, more inbred, the natural healthy genetic variation in the breed is more quickly lost, or bred out.
So, how inbred or outbred are the individuals in the Bernese Mountain Dog breed?
From the report:
The most outbred dog in the population had an IR score of -0.2274, while the most inbred dog in the group had an IR score of +0.1544. The mean IR score for the cohort was -0.0239. The Bernese Mountain Dog IR values are among the lowest calculated for any breed tested at the VGL and suggest an overall low degree of relatedness among parents within this cohort. This is corroborated by the fact that 75% of the dogs had an IR score between -0.2274 and +0.0585. The remaining 25% of the population had IR values from +0.0585 to +0.1544, which represents that these individuals have reasonably related parents. Unlike many other breeds, none of the dogs in this population were from parents related to the level of full-siblings.
Additionally, later, after assessing this population based on a randomly bred, “ideal” population of Southeast Asian village dogs, Dr. Pedersen and Avila noted, “Roughly 75% of this cohort have IRVD values of 0.25 or greater (Table 4, Figure 4), which means that if they were found among village dogs, they would all be considered offspring of at least full sibling parents.”
To translate – a majority of this tested population is outbred for a purebred population. This means the parents of these tested dogs were likely as unrelated as possible within this gene pool. However, this gene pool is quite small and likely had few founders, which is why, when compared to the canine population with the most diversity, they appear to be so closely related. In order to preserve the existing genetic diversity in the breed, breeders must continue to breed dogs that are as unrelated as possible.
While it is clear Bernese Mountain Dog breeders have done a good job creating outbred puppies, it’s far easier to know whether dogs are unrelated for the breed when they are genetically tested rather than looking through very deep pedigrees or using pedigree-based calculations. Additionally, breeders can better assess how close a linebreeding may actually be, as well as whether or not an import is actually an outcross for their program. Breeders could benefit from predictive software that would ease the difficulty of selecting unrelated breeding mates. This would ensure that future breedings are not too close, which would risk health as a result and hasten the loss of healthy variation in the breed. Remember, though, it’s not just about inbreeding.
How much biodiversity exists in the Bernese Mountain Dog today?
Dr. Pedersen analyzes the data collected from the VGL canine diversity test in many different ways in order to assess the total amount of biodiversity within each breed. Many of these measures together give us an overall picture of the state of the breed and as a result we can make informed decisions on breed management.
The best explanation I’ve yet read is from BetterBred Founder Natalie, and as a result we will share it again here!
Most breeders think of DNA as coming in two options- a good gene, or a mutant gene – like it is in many DNA tests. In fact, there can be many versions of each gene or (in this case) marker in a single place on the DNA – like a t-shirt that is available in different colors. The more variants there are, the more information we have about the population genetics of a breed. In more inbred breeds, there are fewer variants for each marker. So to use our analogy, an inbred breed might have only a few colors available in t-shirts, whereas a diverse breed will have t-shirts in many colors. Apart from the relatively small number of genes that make up specific, visible breed traits, the rest of the gene pool is generally healthier when there’s a lot of variation for each marker.
Unfortunately when breeders select too strictly for too long and for very specific traits, there can be an unintended loss of variation in the parts of the DNA that thrive with more variation. A good way to assess whether that good variation has been impacted is by using the markers found in the VGL canine diversity test. Because they are considered neutral – or not associated with any specific known trait – they are great for assessing genetic diversity. In breeds with ample diversity, there will be lots of variations for each marker (lots of colors in the t-shirt drawer.)
But what if you have a breed without much variation? Well, this happens, and can happen quite often. In this case the best thing breeders can do is try to make sure the variants that are in the breed are well distributed – so there are plenty of all of them in the breed. Imagine a t-shirt drawer with lots and lots of red t-shirts but only one blue t-shirt and one green t-shirt. If you lose one of the red ones, it doesn’t change much about the t-shirt drawer – there are lots of other red ones. But if you lose either the blue or green one, the variation is seriously diminished. If, on the other hand a third of the shirts are red, and a third are green and a third are blue, then it’s a lot harder to lose the existing variation in the drawer, even if you lose one once in a while, and even though there are only 3 colors.
The Bernese Mountain Dog’s biodiversity
We discussed the individual dog’s inbreeding levels within the Bernese Mountain Dog population above. However, another use of an individual’s inbreeding value is that we can look at the inbreeding level of all individuals in the breed in aggregate – meaning the whole breed altogether. When a whole breed is very inbred on the same few ancestors, it can result in very little remaining biodiversity within the breed. Therefore when the researchers consider their inbreeding as though they were a part of a population of village dogs (often considered “ideal” for biodiversity because they have retained all the genetic variation found now in modern breeds combined, and more), researchers can estimate the amount of biodiversity remaining in a modern breed compared to all the diversity that once existed in dogs prior to breed formation.
So when this investigation was done for Bernese Mountain Dogs, what did Drs. Pedersen and Avila find?
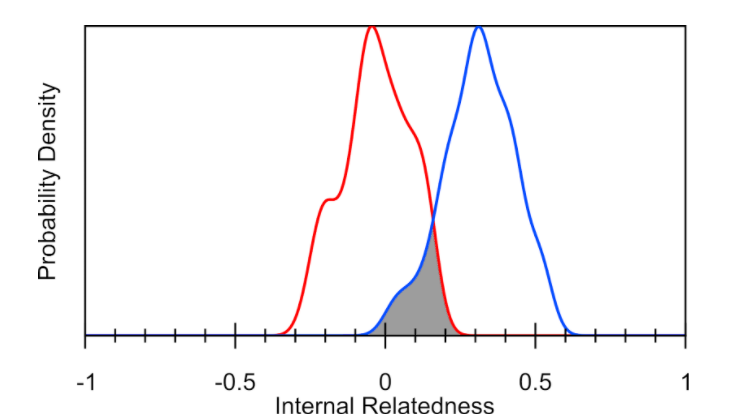
[T]he darkened area in Figure 4 represents the overlap between IR and IRVD curves (13.8%), which is an estimate of the amount of genetic diversity in present-day randomly breeding village dogs that still exists in contemporary Bernese Mountain Dogs. This amount of genetic diversity is slightly over half of the retained genetic diversity (25%) found in all canids tested at the VGL to date (section IIB).
The finding that this cohort of Bernese Mountain Dogs have retained only a small amount of available canid genetic diversity can be explained by different phenomena such as artificial genetic bottlenecks – geographic isolation, natural and man-made catastrophes, breed refinement, popular sire and dam effects, change in interpretation of breed standard, etc. The first loss of diversity probably occurred in the late 1800’s…
Drs Pedersen and Avila
This assessment indicates that there has been a large depletion of genetic diversity in this breed compared to the “ideal”, but let’s look at the data another way:
A secondary way to estimate the loss of biodiversity, due to breed formation and breeding choices post-formation, is to look at the average number of alleles found at each tested locus and to compare those to the other breeds tested to date by UC Davis.
So, if we look at these numbers what do we find out about this population?
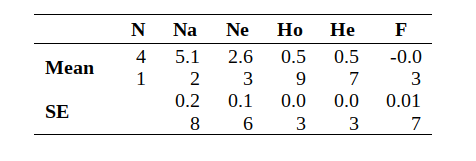
The most noticeable aspect of allelic diversity in the Bernese Mountain Dog is the relatively low number of alleles found at each locus compared to more popular breeds. This number ranged from 3 (e.g., AHTh171-A) to 9 (VGL1063 and VGL1165) alleles per locus in the study cohort. Similar to other pure breeds, one allele predominated at each locus, with the remaining alleles reasonably dispersed in frequency.
….
The average number of alleles (Na) identified in this breed cohort was low, representing 33% of alleles known to exist at each of these loci in all canids tested at the VGL (5.12 out of 15.4). This number is similar to breeds with low genetic diversity such as the English Mastiff (31%) and Swedish Vallhund (31.9%), and significantly lower than the most genetically diverse breeds – the Golden Retriever (54.5%), Toy Poodle (55.6%) and Standard Poodle (58%).
Dr. Niels Pedersen and Felipe Avila
This number predicts that the Bernese Mountain Dog has retained 33% of the existing biodiversity available to canids; this number is much higher than the estimate from the IRVD, which estimated a retention of 13.8% of existing biodiversity. This can be explained because all purebred canids have lost some biodiversity, whereas Southeast Asian village dogs are likely to have conserved most of the biodiversity that existed in the species.
When looking at the number of alleles found, we consider two things: the average number of alleles found in total (Na), and the average number of alleles that are effectively contributing to the population (Ne – effective alleles). Going back to the t-shirt analogy above, say we have 10 t-shirts, and 8 of them are red and one is green and one is yellow. The total number of shirt colors is 3, however the majority color is red, therefore our “effective” t-shirt color would be only 1.
The average alleles per locus in this population was found to be 5.1 (Na). However, Ne (average effective alleles per locus) is a much more telling number, as this is the amount of markers that are effectively contributing to the population’s heterozygosity. This number is currently only 2.6 (Ne). Therefore, this report discovered that the breed is on average only effectively using about 50.9% of it’s total available biodiversity (Ne/Na). It is possible that this number will increase (or decrease) with more of the population sampled.
How does a breed community increase the Ne or average effective alleles per locus? They identify individuals who may have unusual genetics for the population, and work to preserve those genetics and redistribute them in the population at large.
Breed relationships
Another use of the data from the VGL canine diversity test is to see how the individuals within the population fit in relation to one another. What do we see when we look at this analysis, called the PCoA graph?
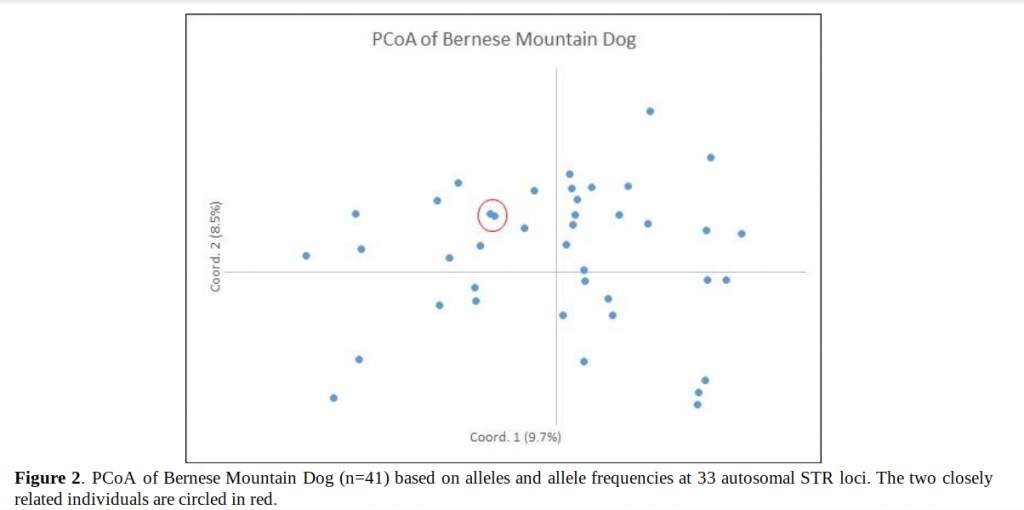
The 41 Bernese Mountain Dog clustered in a way typical of a single population (i.e., a breed) in the PCoA (Figure 2). Individual dogs were reasonably dispersed across all four quadrants of the graph, except for two individuals that graphed together and are therefore more closely related than the others (red circle). Several dogs appeared as outliers from the main population, seen on the periphery of the PCoA. Therefore, it can be assumed that this group of 41 individuals are as unrelated as possible and likely to be representative of the breed.
Dr. Niels Pedersen and Avila
This sampled population seems to have a lot of genetic outliers, with few clustering together. This indicates a couple of things. First, this sample is a good initial sample of the breed, so those who helped collect it were careful in selecting from as many different lines as possible. Secondly, it indicates that there will be ample opportunity to outcross within this population.
After looking a tthe PCoA of the breed by itself, Drs. Pedersen and Avila also look at other related and distantly related breeds to get a picture of how distinct the breed is in comparison and how genetically similar it is or isn’t to other breeds.
Dr. Pedersen chose to compare the Bernese Mountain dog population with Italian Greyhounds and English Mastiffs. In this comparison, the Bernese Mountain Dogs segregate tightly with one another; however there is still evidence of outliers.
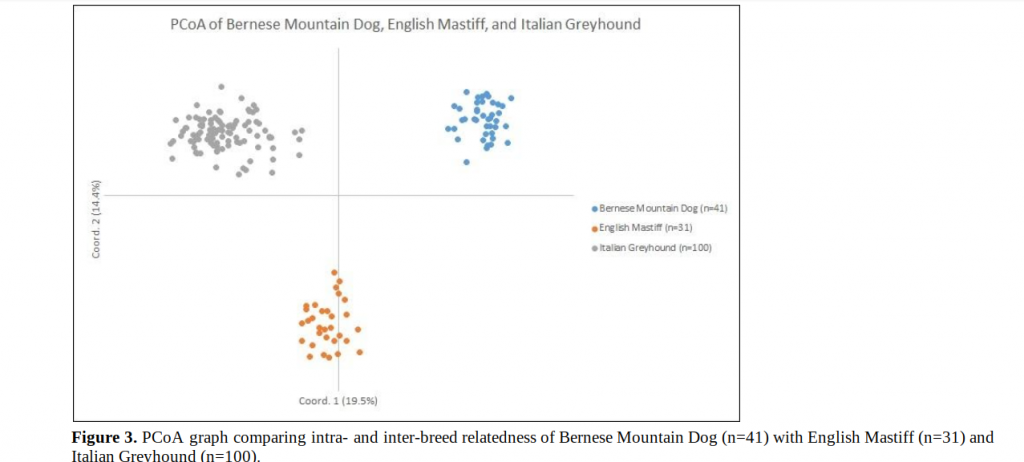
Inter-breed clustering shows separate and well-defined populations, thus indicating that the breeds are genetically distinct as expected. However, this type of comparison accentuates the relatedness of individuals within a breed. The outlier Bernese Mountain Dogs (blue dots) identified in Figure 2 remain dispersed when intra-breed clustering is considered. This clustering pattern indicates that this cohort is quite genotypically diverse at the breed level.
Dr. Niels Pedersen and Avila
The immune system
The UC Davis VGL canine diversity test can identify more regions of the DLA than any other test available today. The Dog Leukocyte Antigen, called the DLA, is the region of the DNA that codes for the immune system in the dog. There are three regions, Class I, Class II and Class III. This test identifies both Class I and II haplotypes. (A haplotype is a tightly linked group of genes within an organism that is inherited as a group from a single parent.) To learn more about the DLA, read here.
From the report:
Eight DLA class I and eight DLA class II haplotypes were identified in this study cohort (Table 5). DLA1 haplotype 1160 was the most frequent, being identified in 70% of the 41 dogs tested; the most frequent DLA2 haplotype was 2024 (68% frequency). The remaining DLA1 and DLA2 haplotypes were identified at lower frequencies (<=10%) in the population. DLA 1160 and 2024 are in linkage and inherited as a larger extended haplotype. The predominance of a single 1160/2024 haplotype is typical of many pure breeds and indicates the importance of a single founder or a founder line in the creation of the breed.
….
DLA haplotype analysis showed extensive DLA1 and DLA2 haplotype sharing with 44 other dog breeds. No haplotype was unique to the Bernese Mountain Dog. However, not surprisingly, one DLA1 haplotype (1221) was found to be shared exclusively among Bernese Mountain Dog, Saint Bernard and Mastiff (Table 6). Similarly, one DLA2 haplotype (2118) was found at lower frequencies in Bernese Mountain Dog and Mastiff (1% and 6%, respectively), but not in other breeds (Table 6). This indicates at least one common and unique ancestor for these two breeds.
Dr. Niels Pedersen and Avila
In summary on the DLA: The Bernese Mountain Dogs have an average to low amount of variation in the DLA in comparison to other breeds. Most dog breeds have 1-2 DLA haplotypes that make up the majority of the DLA haplotypes sampled. Haplotypes 1160 paired with 2024 is carried by a majority of this population, while the other haplotypes are far less well represented. This distribution can be improved by selecting mates with atypical DLA haplotypes and breeding pairs with different Class I/ Class II extended haplotypes. More haplotypes may be found as more Bernese Mountain Dogs are tested.
Conclusions
Based on this report, the Bernese Mountain Dog breeders have been doing a good job creating outbred puppies; however, the breed has below average biodiversity. It will be of great importance to conserve the existing biodiversity so further depletion does not occur due to random loss of alleles – called genetic drift. Breeders can do this by testing their dogs and placing a priority on healthy dogs with less well represented genetics in comparison to the rest of the population, provided they are good, healthy examples of the breed. Using our tools designed to identify these individuals, Average Genetic Relatedness (AGR) and the Outlier Index (OI), breeders can assess these dogs for selection as mates, as well as simulate what to expect in potential litters. Special attention might be warranted to preserve the less typical DLA haplotypes so they are not lost to genetic drift.
Do you own a Bernese Mountain Dog and want to add them to the sample? We particularly need samples from outside the US. Click here to add your Bernese Mountain Dog to the study!