UC Davis has been releasing preliminary breed reports once they feel that they have enough dogs to take a very initial look at a breed. Depending on the sample and how well those initial dogs were selected, it is possible they will represent a good snapshot of the breed. Of course, results will change some as more dogs are added.
So, what did UC Davis’ professor emeritus Dr. Niels Pedersen BS, DVM, PhD find in regard to the Saint Bernard in this preliminary analysis? The following article summarizes the full breed report written by Dr. Pedersen. You can find the full report here.
This report is based on testing of 30 carefully chosen Saint Bernards; chosen to represent unrelated bloodlines within the breed. While 30 individuals is not enough for a final analysis, it should give a good initial approximation of the status of the breed.
How inbred is the typical Saint Bernard?
Internal Relatedness, or IR, is one of the measurements released on each individual dog’s report. This is an often used conservation genetics measurement that estimates how inbred a dog is. It ranges from 0 to 1 when a dog is more inbred, and from 0 to -1 when the dog is outbred. An outbred puppy would inherit genetics from its sire that were very different from those it inherited from its dam. An inbred puppy would inherit many of the exact same genetics from both its dam and sire. Being outbred reduces the likelihood of known and unidentified recessive component diseases expressing in individuals. IRs of individual dogs cannot be compared to determine whether they would be good breeding mates.
So, how inbred or outbred are the individuals in the Saint Bernard breed?
From the preliminary report:
The most inbred dogs had an IR score of 0.340, while the mean (average) IR score for the group was -.011. One fourth of the population had IR scores between 0.068 and 0.340 and were significantly more inbred than other dogs. In contrast, one fourth of the population had IR scores less than -0.079 to -0.179 and were significantly more outbred others in the population.
…….
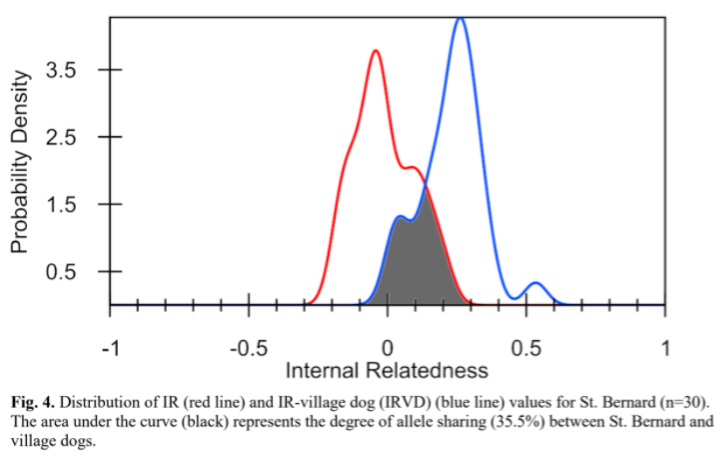
All of the 30 St. Bernard have IRVD values above 0.017 and one half had scores of 0.250 and greater (Table 4; Fig. 4). Therefore, if this group of St. Bernard were compared to village dogs, one half of them would be equivalent of offspring of full-sibling parents.
Dr. Niels Pedersen 2019
To translate – the range of inbreeding in the breed is broad and there are inbred and outbred dogs in the breed. However, when adjusted by comparison to a very diverse breed, many Saint Bernards are very related and inbred. There is also a section of the population that appears to be highly inbred. Because we can’t necessarily detect where dogs fit into the population without DNA testing and analysis, or how to minimize further inbreeding in already inbred lines, this breed can benefit from predictive software aiding in selection of breeding mates, to insure that future breedings are not too close, risking health as a result.
How much biodiversity exists in the Saint Bernard today?
Dr. Pedersen’s reports look at the data from the VGL canine diversity test in many different ways, in order to assess the total amount of biodiversity within a breed. Many of these measures together give us an overall picture of the state of the breed and as a result we can make informed decisions on breed management.
The best explanation I’ve yet read is from BetterBred Founder Natalie, and as a result we will share it again here!
Most breeders think of DNA as coming in two options- a good gene, or a mutant gene – like it is in many DNA tests. In fact, there are many genes or (in this case) markers that come in a great many variations – like a t-shirt that is available in different colors. The more variants there are, the more information we have about population genetics. In more inbred breeds, there are fewer variants for each marker. So an inbred breed might have only a few colors available in t-shirts, whereas a diverse breed will have many colors of t-shirts. Apart from the relatively small number of genes that make up specific, visible breed traits, the rest of the gene pool is generally healthier when there’s lots of variation.
Unfortunately when breeders select too strictly for too long for very specific traits, there can be an unintended loss of variation in the parts of the DNA that thrive with more variation. A good way to assess whether that good variation has been impacted is using the markers found in the VGL canine diversity test. Because they are considered neutral – or not associated with any specific known trait – they are great for assessing genetic diversity. In breeds with ample diversity, there will be lots of variations for each marker (lots of colors in the t-shirt drawer).
But what if you have a breed without much variation? Well, this happens, and can happen quite often. In this case the best thing breeders can do is try to make sure the variants that are in the breed are well distributed – so there are plenty of all of them in the breed. Imagine a t-shirt drawer with lots and lots of red t-shirts and only one blue one and one green one. If you lose one of the red ones, it doesn’t change much about the t-shirt drawer – there are lots of other red ones. But if you lose either the blue or green one, the variation is seriously diminished. If, on the other hand a third of the shirts are red, and a third are green and a third are blue, then it’s a lot harder to lose the existing variation in the drawer, even if you lose one once in a while and even though there are only 3 colors.
The Saint Bernard’s biodiversity
Another use of an individual’s inbreeding value (IR value): we can look at the inbreeding level of all individuals in the breed in aggregate – meaning the whole breed together. When a breed has had very few founders, or has had genetic bottlenecks in its history, whether from breeding practices or world events, it can mean, years later, that there is very little biodiversity left within the breed. By adjusting inbreeding values in comparison to the data from village dogs (often considered the “ideal” comparison), researchers can estimate the remaining biodiversity of a modern breed compared to the original diversity that once existed in dogs prior to breed formation.
So when this investigation was done, what did Dr. Pedersen see?
The darkened area in Figure 4 representing the overlap of IR and IRVD curves is an estimate of the amount (35.5%) of genetic diversity existing in present-day randomly breeding village dogs that still exists in contemporary St. Bernard.
Dr. Niels Pedersen 2019
This assessment indicates there has been loss of biodiversity in this breed from the formation of the breed over time, but let’s look at the data another way.
As mentioned in the quote above, another way to estimate the loss of biodiversity within a breed is to look at the average number of alleles found at each tested locus, and compare those to all the canine breeds thus far tested at UC Davis VGL. When looking at the number of alleles found, we consider two things: the average number of alleles found in total (Na = average alleles), and the average number of alleles that are effectively contributing to the population (Ne = effective alleles). Going back to the t-shirt analogy above, say we have 10 t-shirts…. 8 of them are red and one is green and one is blue. The total number of shirt colors is 3, however the majority color is red, therefore our “effective” t-shirt color would be only 1.
So, by looking at these numbers, what do we find out about this population?
The alleles identified in this group of 30 dogs (Na) represented 5.06 /15.4=33.2% of all known alleles found in canids tested at the VGL. Therefore, these St. Bernards still possess about one third of all available canid genetic diversity. This is higher than the Berger Picard (15.4%), similar to less popular breeds such as the English Mastiff (31%), Swedish Vallhund (31.9%), Irish Red and White Setter (34.8%) and Flat Coated Retriever (38.6%); and considerably lower than popular and genetically diverse breeds such as the Golden Retriever (54.5%), Toy Poodle (55.6%) and Standard Poodle (58%).
Dr. Niels Pedersen 2019
The 30 St. Bernards had an average of 5.06 alleles/loci (Na), but only 3.14/5.06=62% of the alleles were responsible for existing heterogeneity (heterogeneity=genotypic variation=phenotypic variation).
The estimate of remaining biodiversity left after breed formation using this method is 33.2%. Additionally, Dr. Pedersen discovered that there is more diversity within the breed than is being effectively used. What do you do in the case of having diversity not contributing to the breed effectively? You identify individuals who may have unusual genetics for the population, and work to preserve those genetics and redistribute them in the population at large.
These findings may change as more dogs are tested, and it is imperative for conscientious breeders to find and preserve any as yet unseen diversity in the breed. They can accomplish that first by testing as many dogs as possible, and keeping a keen eye out for healthy unusual or long isolated lines where perhaps there may be more variation.
Breed relationships
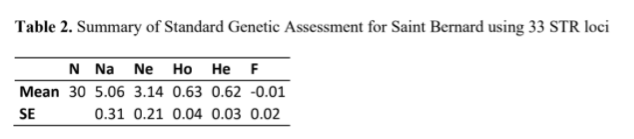
Another use of the data from the VGL canine diversity test is to see how the individuals within the population fit in relation to one another. What do we see when we look at this analysis, called the PCoA graph?
The 30 St. Bernard formed a single population (i.e. breed) in PCoA (Fig. 1). Individual dogs in the group were reasonably dispersed across all four quadrants of the graph. Several individuals appeared as outliers from the main population on the periphery of the graph. It can be assumed, therefore, that this group of 30 dogs were as unrelated to each other as possible given their level of genetic diversity and representative of the breed as a whole.
Dr. Niels Pedersen 2019
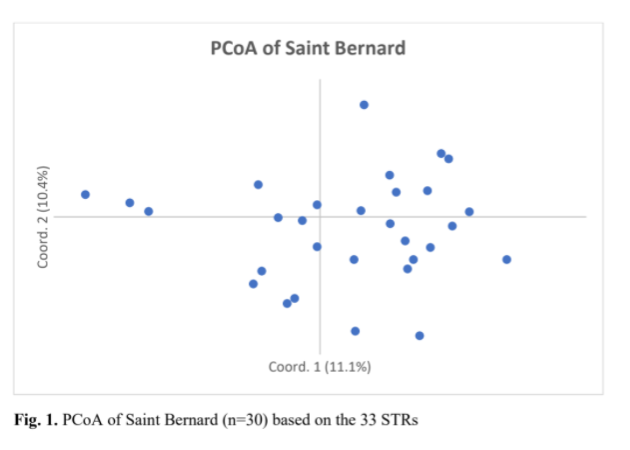
What about when we compare the Saint Bernard with other breeds??
In order to enhance relatedness between individuals in a breed, English mastiff and Irish Wolfhound, were added to the graph (Fig. 3). As expected, the three breeds appeared to be genetically distinct. However, at least one English Mastiff appeared to be almost as closely related to St. Bernard as to its own breed. Also, this comparison caused the St. Bernard to cluster more closely together, something also seen with the Irish wolfhound. However, the English Mastiff remained more dispersed. This indicated that English Mastiffs have more genotypic and phenotypic variation than either St. Bernard or Irish Wolfhound.
Dr. Niels Pedersen 2019
The immune system
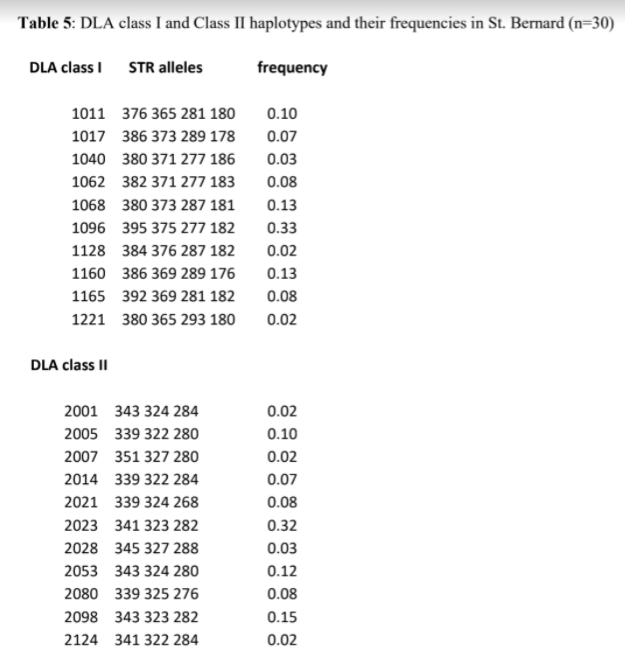
The UC Davis VGL canine diversity test can individually identify more regions of the DLA than any other test available today. The DLA, called Dog Leukocyte Antigen, is the region of the DNA that codes for the immune system in the dog. There are three regions, Class I, Class II and Class III. This test identifies both Class I and II haplotypes (a haplotype is a tightly linked group of genes within an organism that is inherited as a group from a single parent). To learn more about the DLA, read here.
The 30 St. Bernards that were tested possessed 10 DLA class I and 11 DLA class II haplotypes (Table 5). It is likely that several more class I and II haplotypes will be found as more dogs are tested, but they will likely occur at low frequency. The numbers of DLA class I, II haplotypes was higher than the Berger Picard (2, 2), Swedish Vallhund (6, 4) and Shiloh Shepherd (7, 6), somewhat lower than small breeds such as the Giant Schnauzer (14, 15), Samoyed (13, 12) and Shiba Inu (16, 15), and much lower than popular breeds such as the Golden Retriever (26, 23) and Miniature Poodle (33, 23).
Dr. Niels Pedersen 2019
The 30 dogs tested possessed no unique DLA class I haplotypes and only one unique DLA class II haplotype (2124) (Table 5). Only one DLA class I (1096) and class II (2023) haplotype occurred at a disproportionately high frequency (33%). These two haplotypes were in linkage disequilibrium (LD), forming and extended 1096/2023 haplotype, which is unique to St. Bernard. All the remaining haplotypes occurred at low and almost equal frequencies.
….
Interestingly, the DLA class I 1221 haplotype was found only in St. Bernard, English mastiff and Mastiff, indicating at least one common and unique ancestor.
Breeders should take some caution to make sure that the less well represented DLA haplotypes are not lost to genetic drift from this breed. The Saint Bernard population has maintained a low- mid level amount of DLA in comparison to other tested breeds.
Conclusions
The following conclusions from Dr. Pedersen sum up the findings from the Saint Bernards tested thus far.
The biggest problem facing pure breeders of dogs are the disease traits that are of Mendelian origin. Three hundred thirty-two disorders that follow simple Mendelian inheritance have been identified in dogs to date, of which 266 have known causal mutations [23]. Mendelian traits are usually autosomal recessive in nature and frequently in linkage with a region of the genome that has been subjected to strong positive selection for a phenotype that is deemed desirable in the show ring or for some specific performance. A lack of genetic diversity has two effects on Mendelian disease traits. The less diversity that is present in a breed, the more likely that bouts of artificial selection for certain desired traits (form or function) will lead to the appearance of simple genetic diseases. The second problem with low genetic diversity involves how the appearance of a simple genetic trait will be handled. Elimination of such deleterious mutations may result in loss of genetic diversity, especially when diversity is already limited [22]. In such cases, breeders must not eliminate the trait, but rather must breed around it by selecting parents that will not produce affected puppies. Therefore, breeds that lack genetic diversity must be managed much more closely to avoid further loss of genetic diversity (to minimize Mendelian disorders) and use more caution when dealing with how they are managed [21, 22]. Fortunately, St. Bernard breeders have comparatively few deleterious Mendelian traits to deal with compared
Dr. Niels Pedersen 2019
to many other breeds. Type 1 von Willebrand’s and degenerative myelopathy are present in many breeds and most likely were introduced in the founders. The clinical manifestation of these disorders is often inapparent, mild, or delayed, causing them to be ignored in many cases.
Juvenile polyneuropathy appears in both St. Bernard and Leonberger [18], suggesting that it is a more ancient mutation that was captured from a common founder or founder line. Lack of genetic diversity in the DLA region is another problem that many pure breeds have to deal with. Loss of genetic diversity in the DLA region is commonly associated with an increase in the incidence and manifestations of autoimmune disorders, allergic conditions, and increased susceptibility to specific infectious agents. There is even question whether disorders of unknown etiology, such as epilepsy and cardiomyopathy, may also be forms of autoimmunity. At present, St. Bernard do not appear to suffer any more greatly from autoimmune disorders, allergies, and specific infectious diseases than many other breeds and even mongrels. However, there is wisdom in retaining as much diversity (heterogeneity) in the DLA region as in other parts of the genome and to avoid homozygosity. Imbalances in DLA types can also be addressed by concentrating whenever possible on using dogs for breeding that have rarer types.
As more of the Saint Bernard’s worldwide population is tested, it will become more apparent how the population is structured. Is there a genetic bottleneck? The breed thus far seems to have maintained a medium amount of biodiversity in comparison to other tested breeds, and more will likely be found as more dogs around the globe are contributed.
In the meantime, BetterBred’s breed management tools will help them effectively maintain this biodiversity. This can be accomplished by breeding for dogs that are less related to other dogs in the database, dogs that have genetics that are not well represented in the population as well as selecting for litters whose parents will be as unrelated as is reasonable (and therefore reducing inbreeding in offspring).